WebPagetest is a free website speed test tool made available to the public. Simply enter your website or individual web page URL, followed by selecting your desired location and browser type that you want to test with. Click the “Start Test” button and the test results are out in 3 – 5 minutes.
Since the tool is free to the community, there are many other individuals from all over the world running WebPagetest at the same time. Please be patient to wait for the test results if there happens to be a long queue. On the other hand, you can consider to download and host on your own server for your own usage at convenience.
Test Result Summary Table
Let’s drive into analyzing the website speed test results. The metrics table below is the summary of the test results.
What do each metric means?
Load Time: 11.728s
It took 11.728s to load all the content objects, which may include Javascript, CSS, images, 3rd party scripts on the page.
First Byte: 1.548s
This First Byte time refers to the processing time taken on the server side in order to display the web page. A dynamic web page usually results in a longer First Byte time than a static web page, as the server needs to access database and process the data extraction before loading the dynamic page.
Start Render: 3.653s
This refers to the point of time when the browser start to render and display the content objects
Document Complete Time: 11.728s
This refers to the point of time when the browser finishes loading all content objects except object content that are triggered by Javascript execution.
Fully Loaded Time: 12.073s
This refers to the point of time when there are no more data transfer between server and browser. This metric includes the time taken for any asynchronous Javascript execution after the Document Complete Time.
Insights from Test Result Summary Table
The rendering time of 8.075s (Document Complete Time – Start Render Time: 11.728s – 3.653s) and 198 HTTP requests suggest that web page has too many objects to load, which mostly are images for this case.
What can be done?
- Group the commonly used images to create CSS Sprite. This reduces the number of HTTP requests and the rendering time
- Practice the right image compression for all your images. A portrait image saved in GIF format not only displays awfully on the web page but also lead to slower page loading. Seek advice from your web designer if you are unsure of the image formats.
Test Result Waterfall Chart
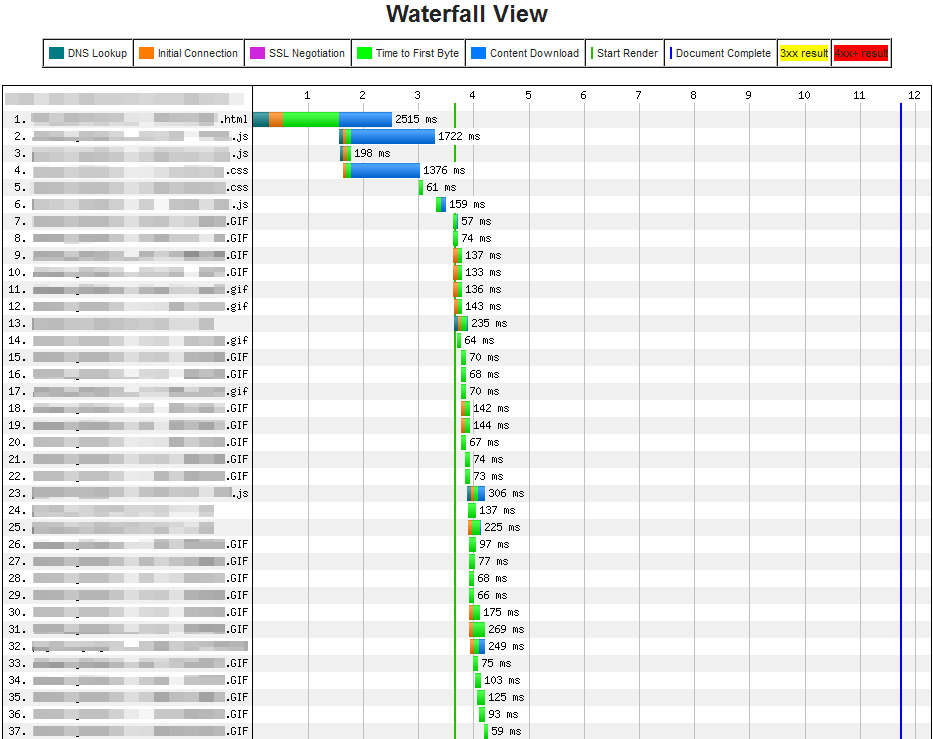
Now, let’s see how the below Waterfall Chart of the test result can provide us with more insights.
Insights from Test Result Waterfall Chart
The web page has large size Javascript and CSS files (highlighted with red circle in the above Waterfall Chart) that are blocking the rest of the content download. The blue portion of these blocking Javascript and CSS refers to the Content Download Time, which suggests that their file size is relatively large. Worse of all, these files took up much downloading time before the browser starts to render the web page.
What can be done?
- Remove most of the unused CSS and Javascript functions from these files to reduce the file size. Minifying these files can improve the Start Render Time.
- Less critical Javascript functions can be coded at the bottom of the web page to load asynchronously.
Key Takeaways
- It requires an individual to understand the back-end and technical stuff, before able to analyze insights from the website speed test result metrics. If you are not a technical-savvy individual, suggest that you can consult someone with technical background.
- It is vital to relate the website speed to the business benefits. How much has your website speed improved after implementing the changes? Has the load time improvements garner better more visits or conversion on you website? By answering these questions, it set you thinking whether to spend effort in optimizing your website speed.
Reference: WebPagetest Documentation


